Trade Geometry Analyzer
Diagnostic engine for analyzing post-entry behavior of trading signals

![]()
![]()

Quick Install
Why This Library Exists
You've spent weeks developing a trading signal. Your backtest shows a Sharpe of 1.8, healthy win rate, and promising equity curve. You're ready to deploy, but then the critical questions hit: Where do I place my stop-loss? What take-profit makes sense? Should I trail? Do I need room to breathe or does this signal profit quickly? Your backtest optimized the entry, but the exit rules are still a guess.
Traditional backtesting tools tell you if your signal has an edge. They don't tell you how that edge manifests in the price path after entry. You end up grid-searching TP/SL parameters, overfitting to your sample, and deploying with exit rules that are either too tight (death by a thousand stops) or too wide (giving back all your winners). The problem isn't your signal—it's that you're flying blind on risk management.
Here's what you actually need to know: When you enter a trade, does the profit come immediately or does the position need to drawdown first? What's the typical max adverse excursion before the move plays out? If you set a 1% stop, what percentage of your edge survives? Are there distinct trade archetypes within your signal—some that are fast winners and others that need patience? These aren't backtesting questions. These are geometry questions.
This library answers them. You feed in your OHLC data and signal, and it extracts the forward price path from every entry point. It calculates the maximum favorable and adverse excursion within your horizon, tracks when each occurs, and builds empirical distributions of these outcomes. Then it answers the questions that matter: where are the natural risk/reward boundaries? What TP/SL combinations are actually feasible based on observed paths? Does your signal show MFE-first behavior (trailing-stop friendly) or MAE-first (needs room)? Should your stops scale with volatility? Are there hidden clusters of trades that need different exit strategies?
The output isn't another backtest metric or optimization result. It's a diagnostic map of your signal's post-entry behavior. You get probability heatmaps showing realistic TP/SL zones, frontier curves with knee points that reveal optimal stop sizing, regime analysis that shows whether your edge is volatility-dependent, and clustering that identifies trade archetypes you didn't know existed. Every insight is path-dependent and empirically grounded—no assumptions about distributions, no parametric models, just the actual geometry of what happens after you enter.
This is the tool you wish existed when you were staring at that "optimal" TP/SL from your grid search, wondering if it would survive the next regime change. Install it, point it at your signal, and get answers you can actually use in production.
Example Visualizations
Here's what you get from running the analyzer on a real trading strategy:
| **Trade Geometry** 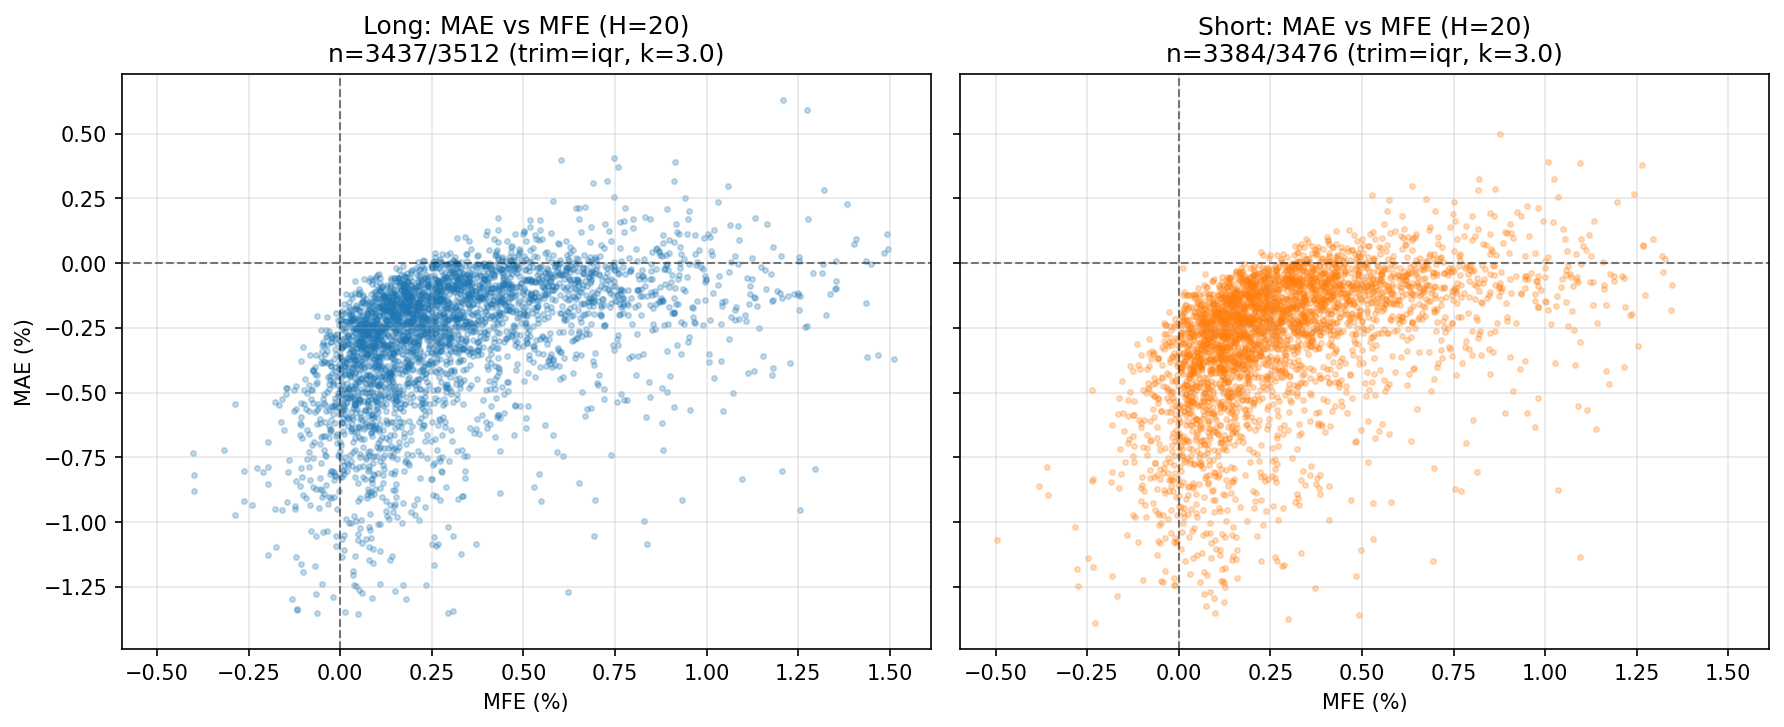 | **TP/SL Probability** 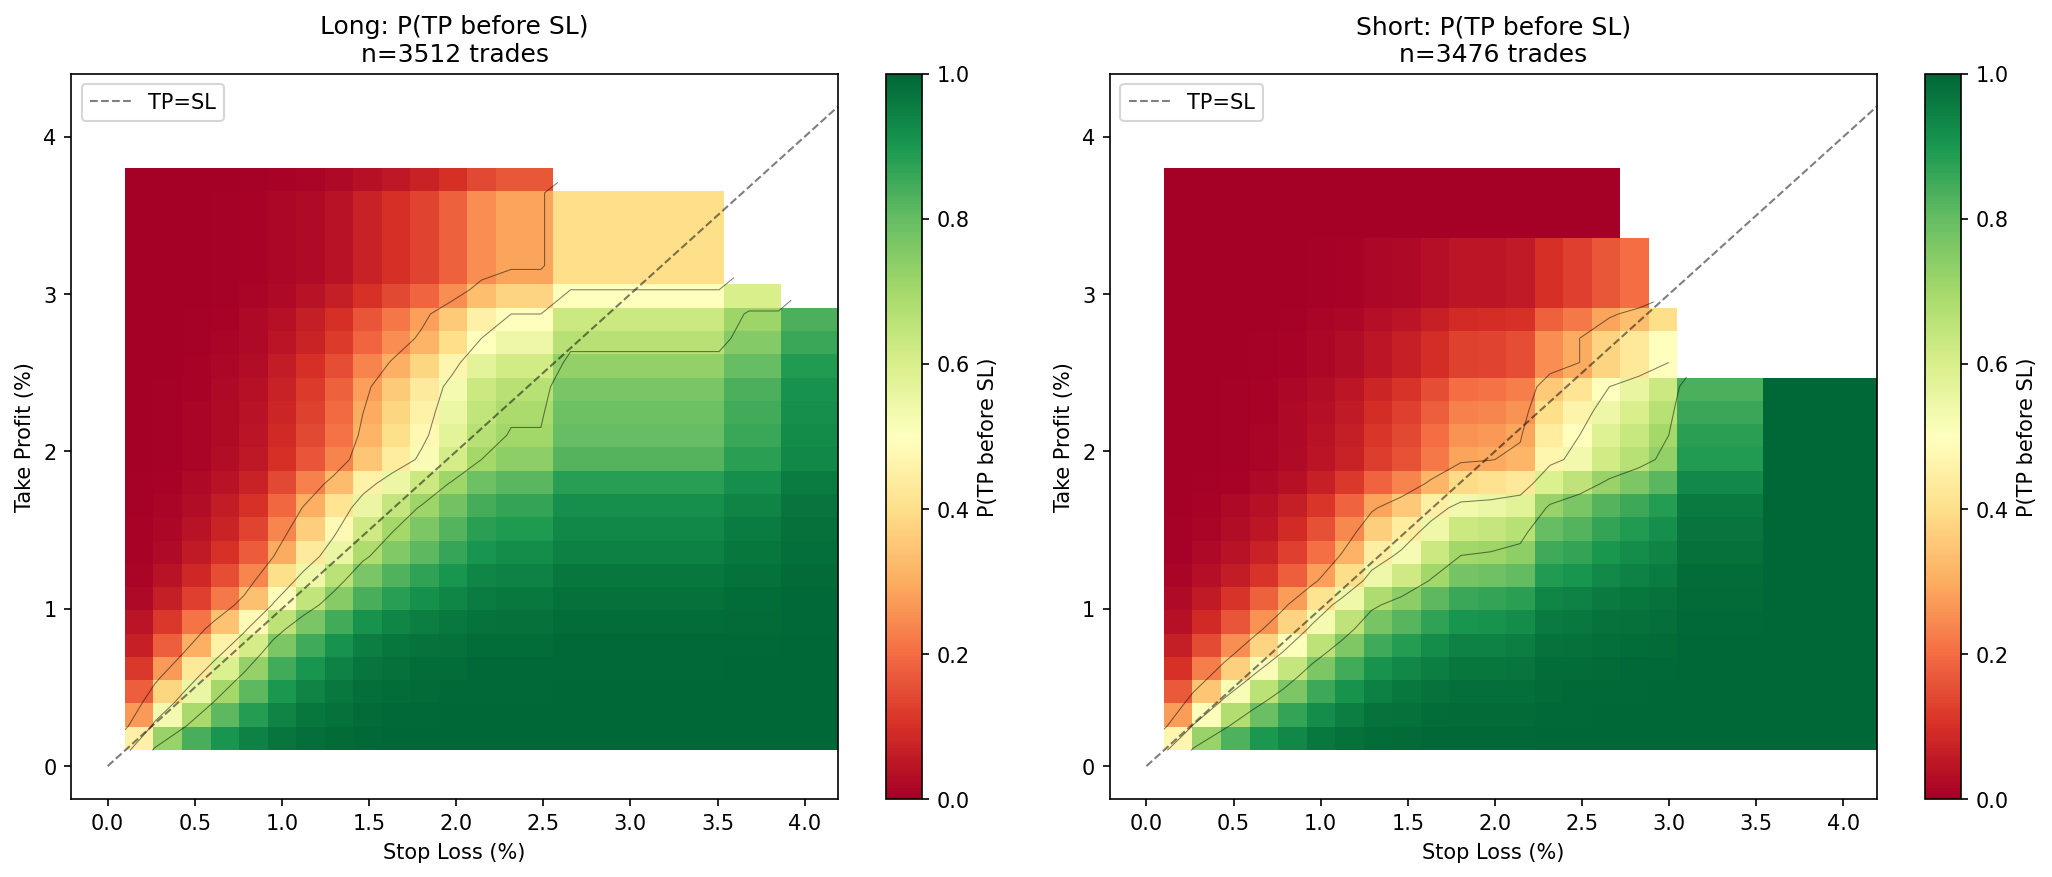 |
| **Risk/Reward Frontiers** 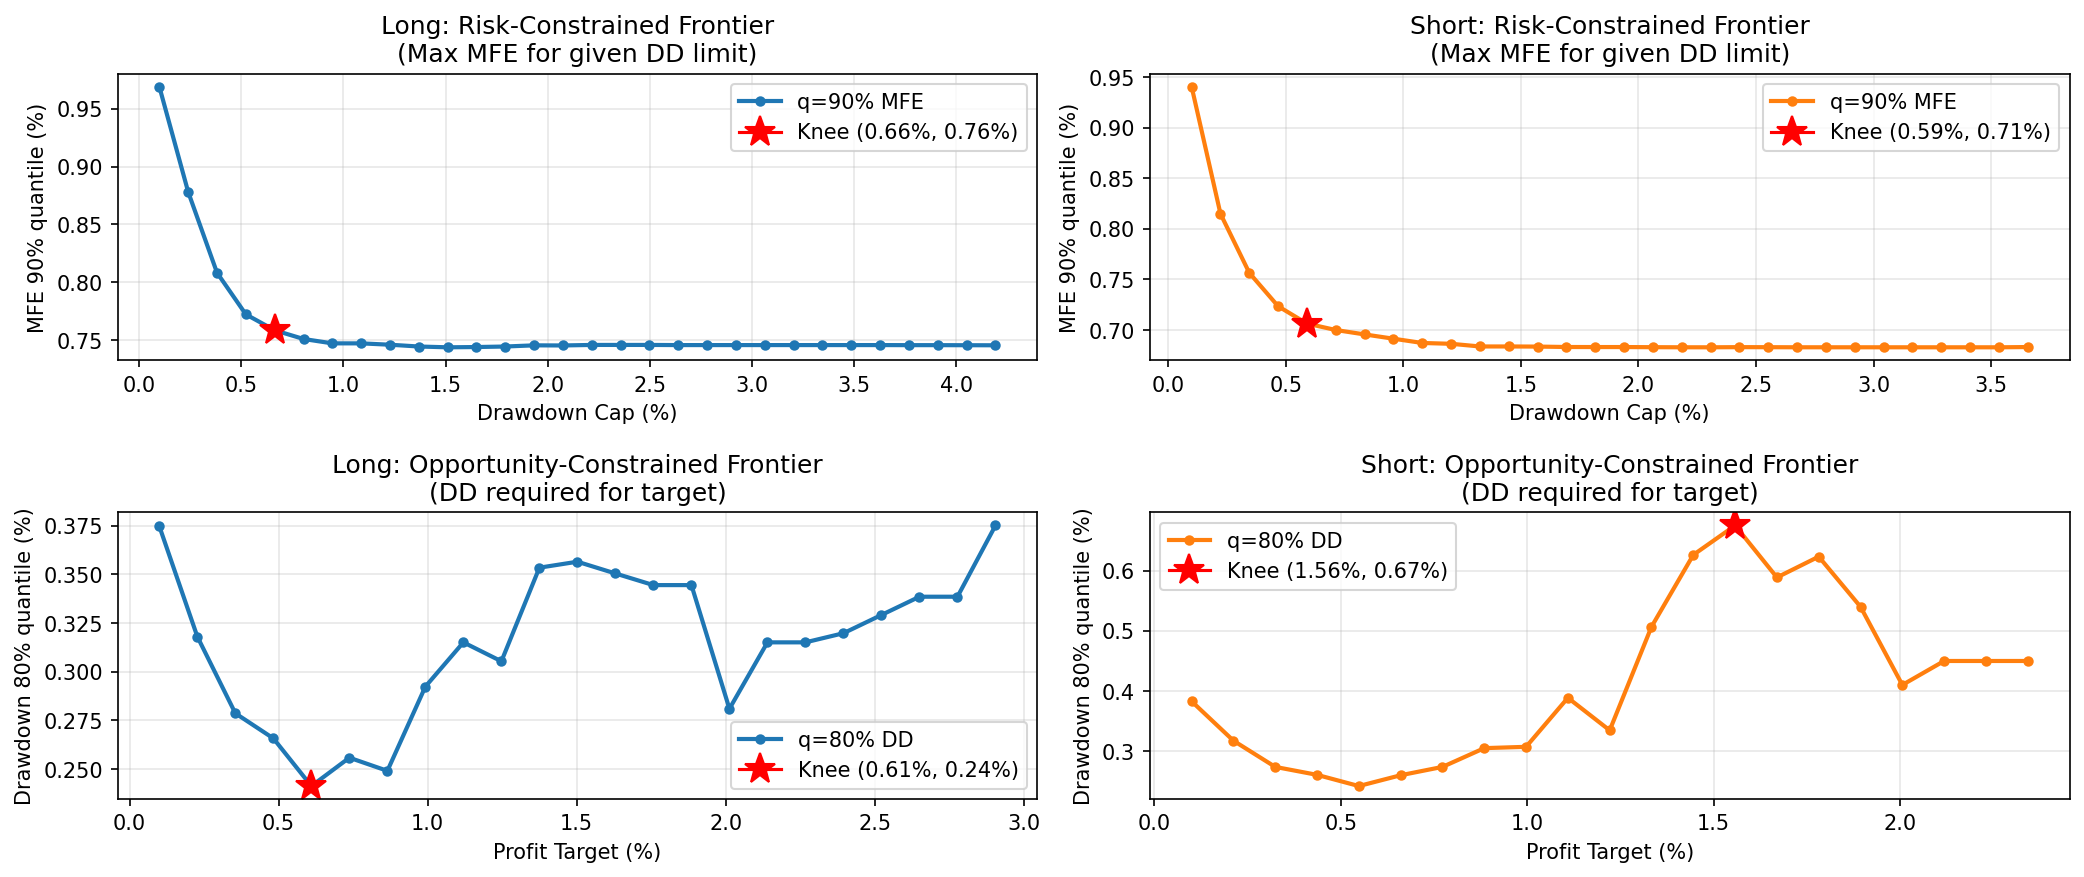 | **Time Sequencing** 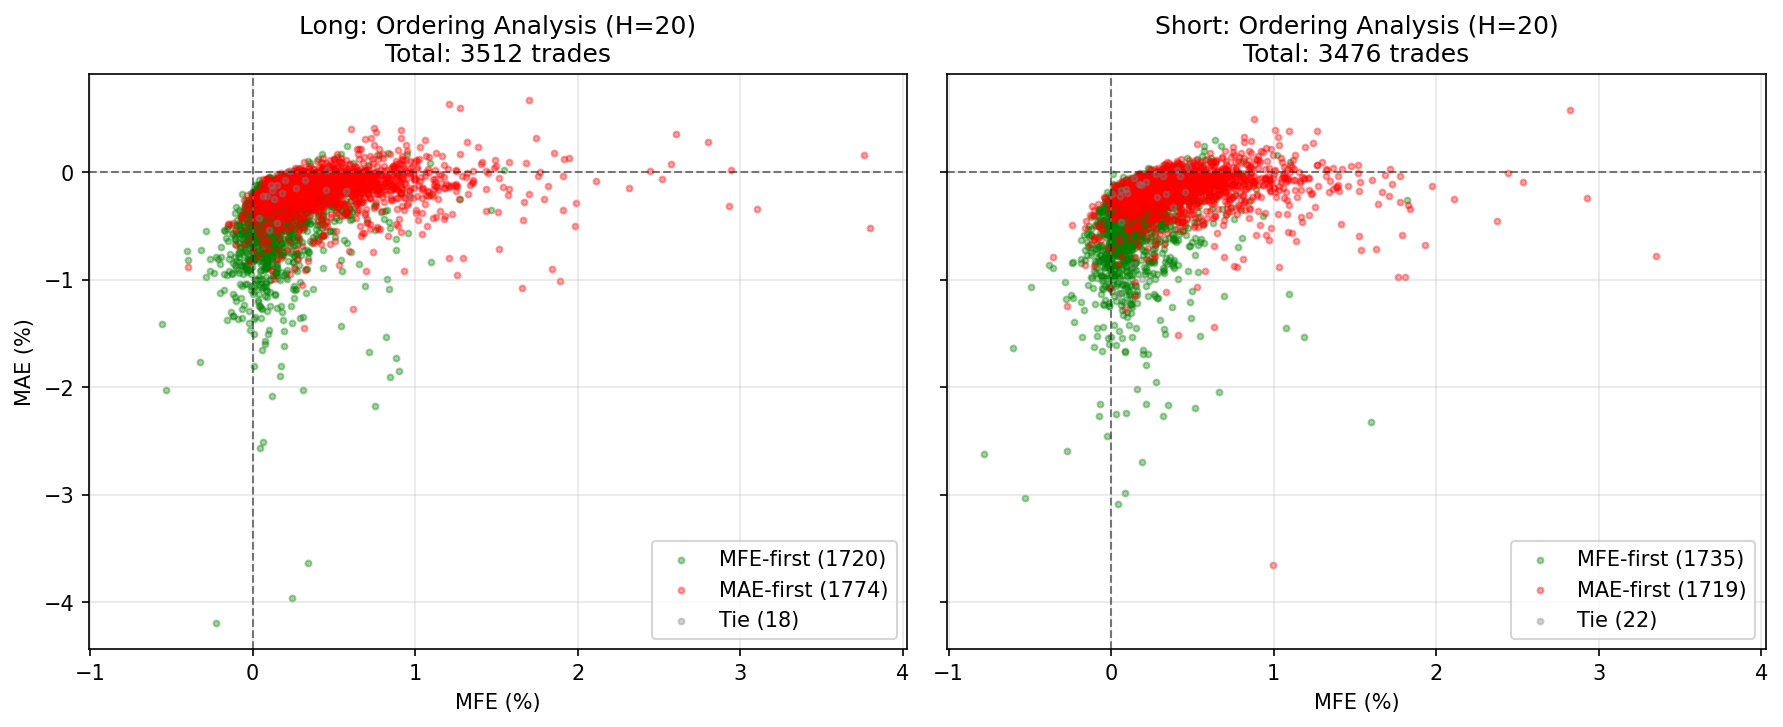 |
Analysis run on EURGBP hourly data (3,500+ trades). See Examples for all visualizations.
Quick Example
import pandas as pd
from signal_analyzer import analyze, AnalysisConfig

# Your OHLC data with signals
df = pd.DataFrame({
    'Open': [...],
    'High': [...],
    'Low': [...],
    'Close': [...],
    'sig': [1, -1, 0, 1, ...],  # +1=long, -1=short, 0=neutral
})

# Configure analysis
config = AnalysisConfig(
    H=20,                        # 20-bar forward horizon
    sections=['A', 'B', 'C', 'D'],  # Run these sections
    store_paths=True,            # Required for Section D
)

# Run analysis
result = analyze(df, sig_col='sig', config=config)

# Access results
print(result.section_a['long']['metrics'])
print(result.section_d['long']['best_zones'][:5])

# Show plots
import matplotlib.pyplot as plt
plt.show()
Features
- 6 Analysis Sections: Geometry, Frontiers, Ordering, TP/SL, Volatility, Clusters
- 14 Visualization Types: Scatter plots, heatmaps, frontier curves, regime analysis
- Path-Dependent Analysis: True probability of hitting TP before SL
- Volatility Normalization: Scale metrics by ATR for regime-independent insights
- Trade Clustering: Identify distinct archetypes within your signal
- Production-Ready: Fast vectorized NumPy operations, handles 10K+ trades easily
Next Steps
-
Quick Start
Install and run your first analysis in 5 minutes
-
User Guide
Deep dive into each analysis section with examples
-
API Reference
Complete API documentation with all functions and classes
-
Examples
See all visualizations from a real trading strategy